
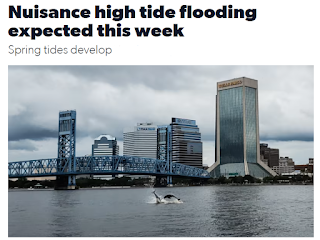
I read this article in the paper this morning to my students. It was a good review of our tides lesson (Cornell Notes, Cut & Paste Activity *Google Drag & Drop for online students).
- Spring tides don't have anything to do with the Spring season.
- A spring tide means that high tides are higher and low tides are lower than average because the gravitational pull of the Sun is “added” to the pull of the Moon on Earth, causing the oceans to bulge more than normal.
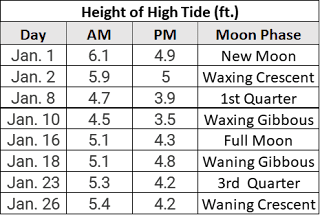
*Only the 1st day of each moon phase is recorded
Next I used Excel to make a graph and asked students to look for trends.

- What was the highest high tide?
- What was the lowest high tide?
- What is the difference (in ft.) between the highest and lowest high tides?
- When was the last spring tide (date and moon phase)?
Extentions:
- Have student make the table & graph as a lab activity instead of a warm-up discussion
- Graph the AM & PM low tides and identify Neap tides *use this as a exit ticket/formative assessment
- Graph all the data for the month and identify moon phases and Spring/Neap tides
ANSWERS
1. Jan. 1, 6.1 ft. (AM)
2. Jan. 10, 3.5 ft. (AM)
3. 6.1 ft. - 3.5 ft. = 2.6 ft. *the article predicted our tides would be 1-2 ft. higher
4. Jan. 1, New Moon
2. Jan. 10, 3.5 ft. (AM)
3. 6.1 ft. - 3.5 ft. = 2.6 ft. *the article predicted our tides would be 1-2 ft. higher
4. Jan. 1, New Moon
